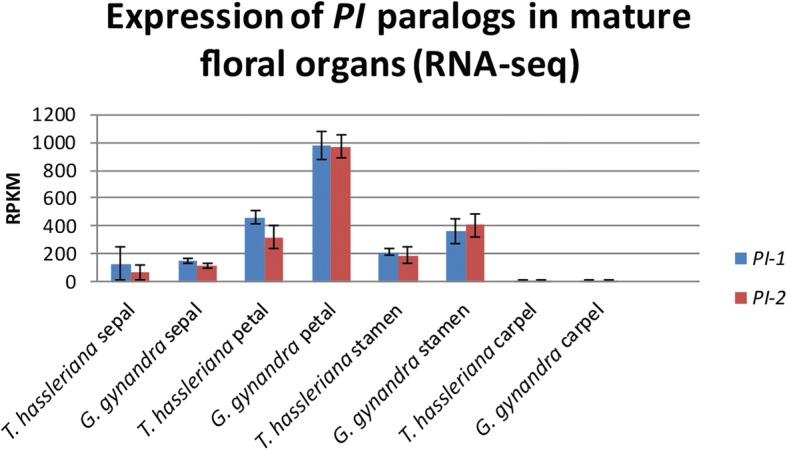
Fig. 4.

Expression levels of ThPI-1 and ThPI-2, according to RNA-seq data of mature floral organs. Error bars represent standard deviation. RPKM = reads per kilobase of transcript per million mapped reads. RNA-seq data obtained from [72]

Expression levels of ThPI-1 and ThPI-2, according to RNA-seq data of mature floral organs. Error bars represent standard deviation. RPKM = reads per kilobase of transcript per million mapped reads. RNA-seq data obtained from [72]