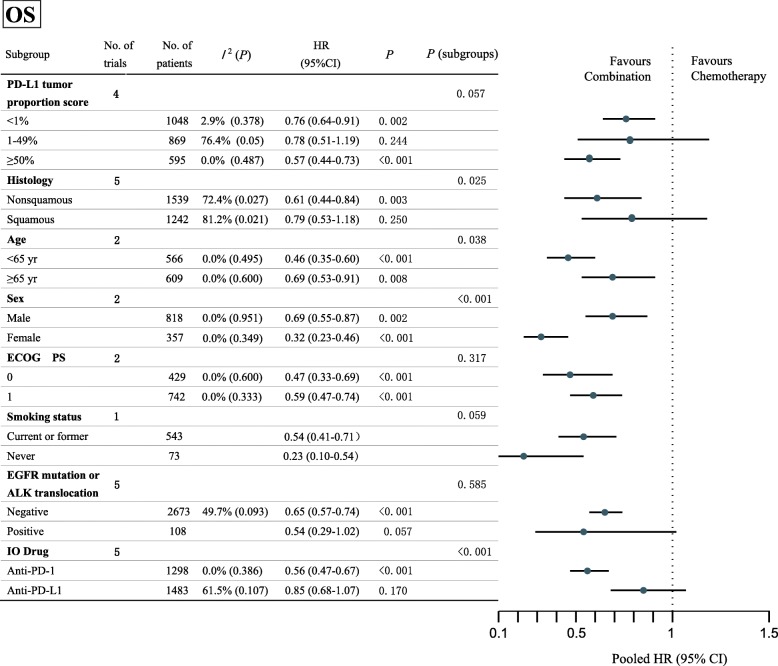
Fig. 2.
Forest plot of hazard ratios in subgroup-analyses comparing overall survival in patients who received IO-Chemotherapy vs Chemotherapy alone. The horizontal line crossing the dot represents the 95%CI of the pooled hazard ratio in each subgroup-analysis. No. of trials refers to the number of trials included in each subgroup-analysis. I2 (P) shows the heterogeneity in each subgroup meta-analysis. P (subgroups) demonstrates the significance of differences between the subgroups. HR, hazard ratio; CI, confidence interval; ECOG PS, Eastern Cooperative Oncology Group performance status; EGFR, epidermal growth factor receptor; ALK, Anaplastic lymphoma kinase; PD-1, programmed cell death 1; PD-L1, programmed cell death 1 ligand 1; IO, Immuno-oncology

