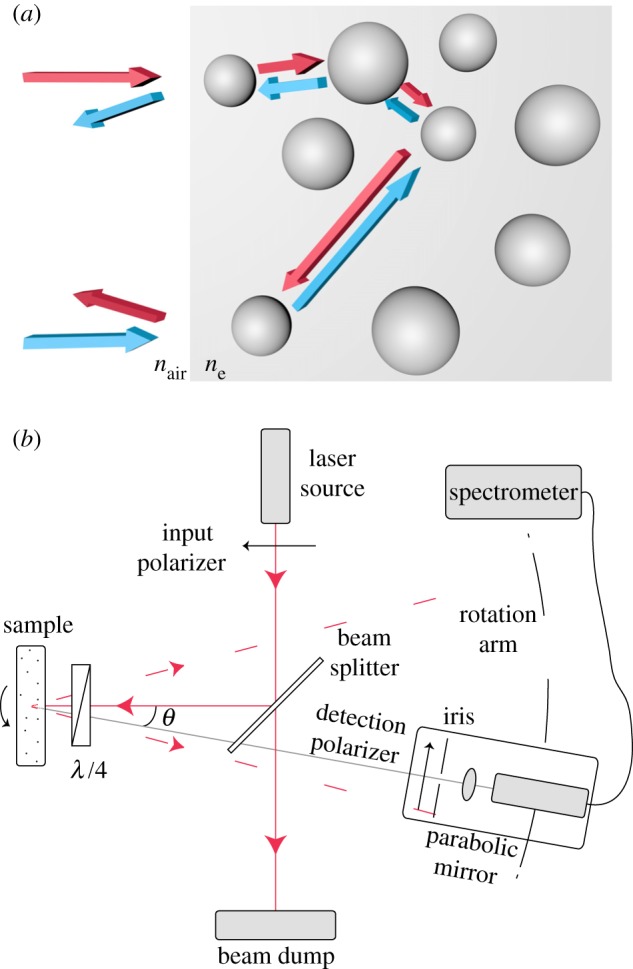
Figure 2.

(a) Illustration of two counter-propagating photons, red and light blue arrows. For simplicity, the scattering centres are represented as spheres. (b) Schematic of the CBS set-up in an HC configuration: the red dashed lines define the cone of backscattered intensity, while the grey line represents the detection rotation. The sample was mounted on a rotation mount, whose axis was perpendicular to the propagation direction of the laser beam, to average over different disorder realizations.
