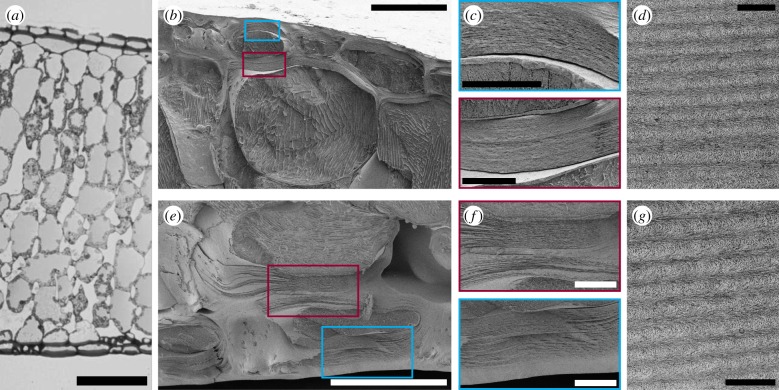
Figure 2.
(a) Optical transmission micrograph of semi-thin cross section of embedded frond. Scale bar is 200 µm. (b,e) Cryo-SEM images of adaxial and abaxial epidermal cells of the frond, respectively. Scale bar is 50 µm. (c,f) Zoom of epidermal cell walls in the blue/red boxes for adaxial and abaxial epidermis, respectively. Scale bar is 10 µm. (d,g) TEM images of adaxial and abaxial cell wall, respectively, showing the Bouligand arcs characteristic for the helicoidal arrangement of cellulose microfibrils. Scale bar is 500 nm.

