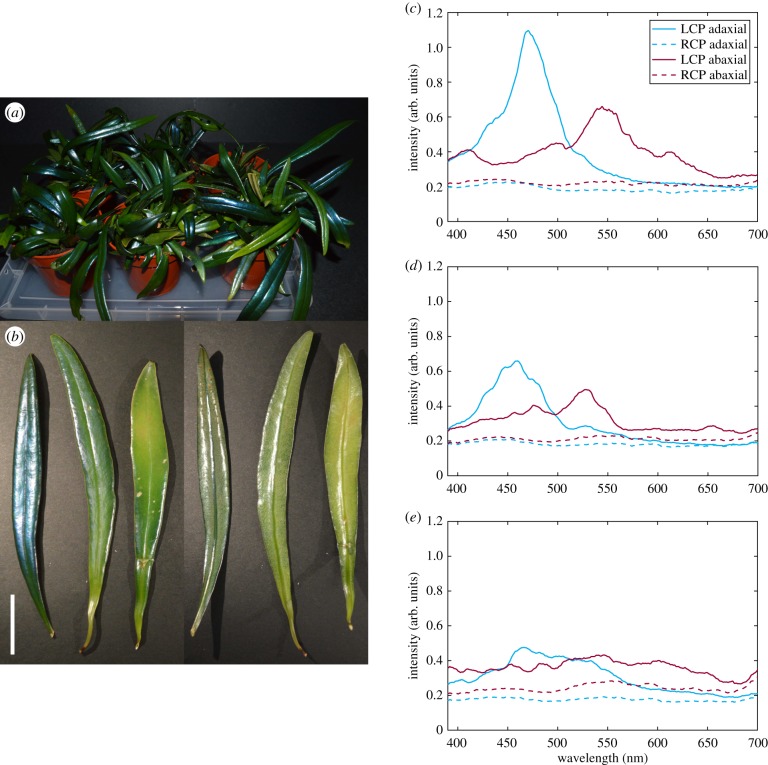
Figure 3.
(a) Photo of a variety of specimens. (b) Photo of the adaxial (left) and abaxial (right) surface of three fronds showing high, medium and low structural coloration, from left to right. Scale bar is 2 cm. (c–e) Average reflection spectra in LCP and RCP of frond, adaxial and abaxial surface. (c) Spectra of the most intensely structurally coloured frond. (d) Spectra of the medium structurally coloured frond. (e) Spectra of the low structurally coloured frond. All spectra are averaged from measurements of nine cells each across the frond.

