Figure 5.
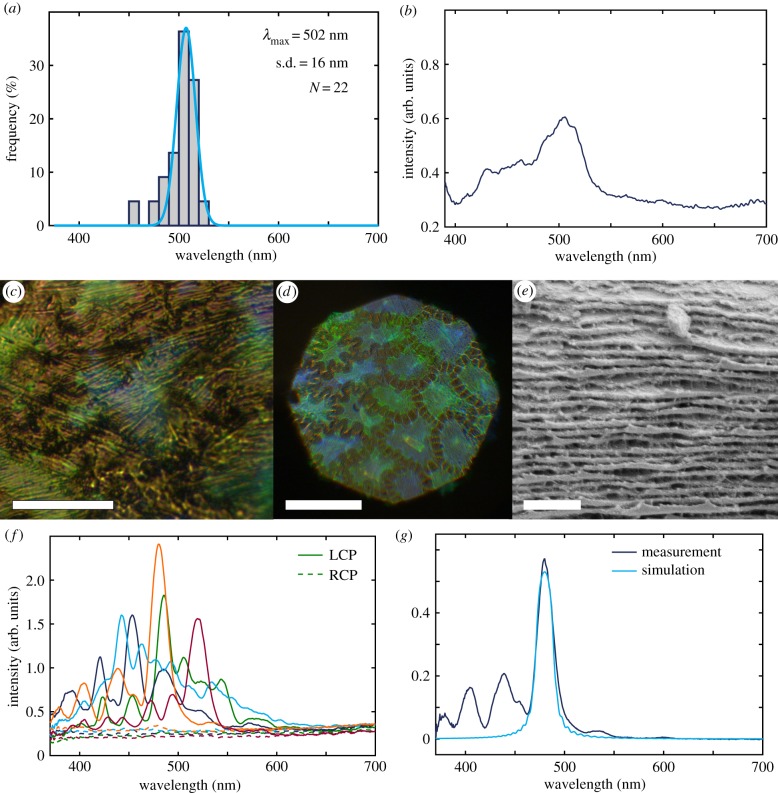
(a) Reflection maxima distribution of single cell. (b) Average spectrum of all 22 LCP spectra from single cell. (c) Optical micrograph of reflection in LCP of single cell of adaxial surface. Scale bar is 20 µm. (d) Optical micrograph of reflection in LCP of adaxial surface, specific part of frond for cryo-SEM. Scale bar is 100 µm. (e) Cryo-SEM micrograph zoom of the helicoidal layering, adaxial surface. Scale bar is 1 µm. (f) Individual reflection spectra in LCP and RCP of five cells of a specific part of frond taken for cryo-SEM, adaxial. (g) Measurement taken from a single cell and simulation based on the Berreman 4×4 method (referenced to silver mirror).

