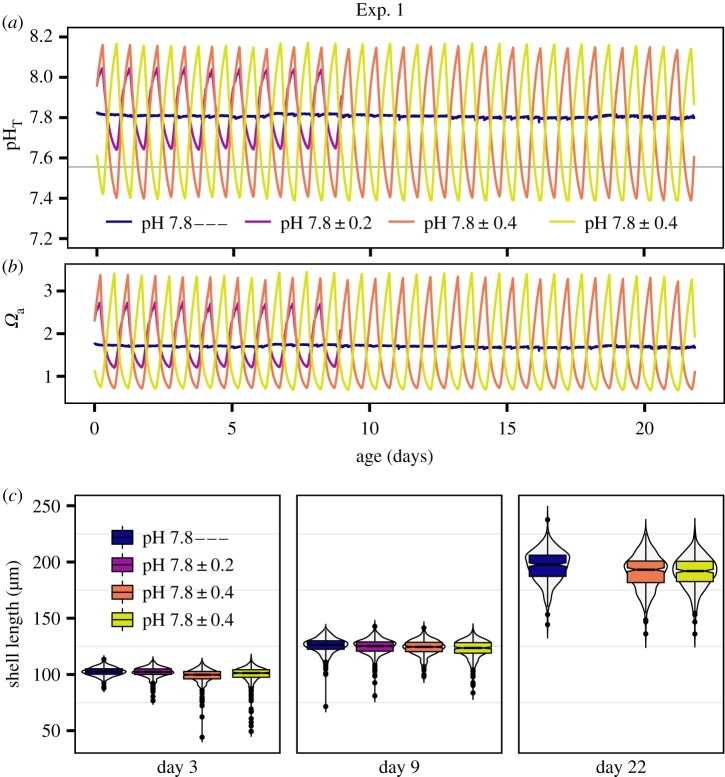
Figure 1.
D-veliger shell size correlates to mean exposures: Exp. 1. (a) pH time series of Exp. 1, grey references Ωa = 1, hpf is hours post-fertilization. (b) Ωa time series of Exp. 1. (c) Shell size of larvae in Exp. 1 on days 3, 9 and 22. Box plots denote median, median confidence interval (notch width), quartiles and outliers (dots). Violin plots show the size distribution of the observations (n ≈ 300).

