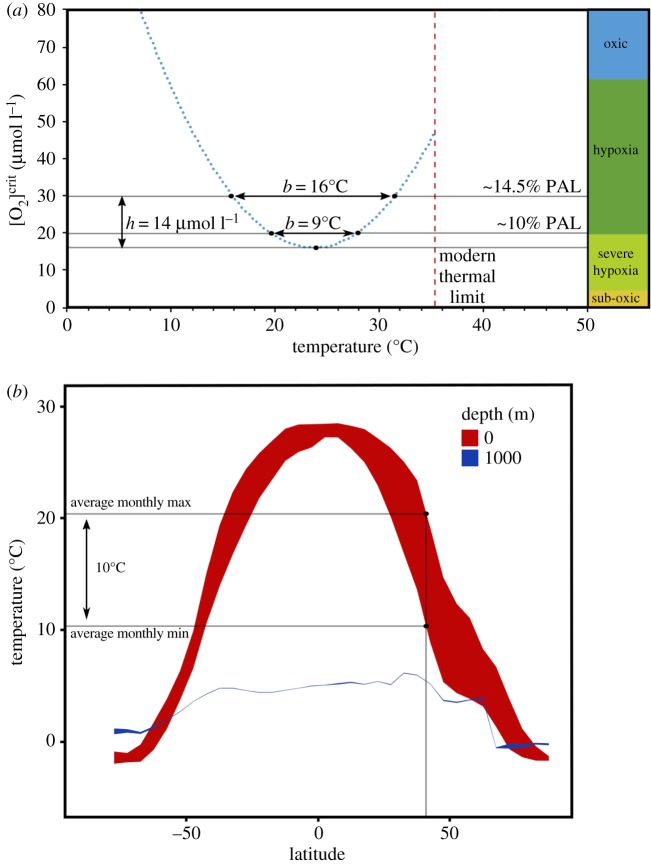
Figure 4.
Impact of seasonal temperature variation on aerobic respiration in low pO2 conditions. (a) Polynomial regression run through the [O2]crit field of D. lineata (R2 = 0.75). The region above this blue dashed line represents the temperature and O2 conditions in which this species can maintain aerobic respiration (note that the regression vertex does not perfectly correspond with the lowermost measured [O2]crit value). While the exact equation of the polynomial probably differs between species, the bidirectional nature of O2 tolerance with respect to temperature is probably universal [46]. Because the area of this aerobic field (A) is dependent on the severity of hypoxia h, and the thermal range of the environment b, lower ambient concentrations of dissolved O2 result in a narrower thermal range of aerobic respiration. Black horizontal lines represent O2 levels at 14.5% PAL, 10% PAL, and the vertex of the parabola. The red dashed line is approximately 35°C, the average upper critical (lethal) long-term thermal limit of many shallow-water ectotherms living in modern tropical environments [66]. Descriptive low-O2 state boundaries are adapted from [67]. (b) Average seasonal temperature ranges across all latitudes of the global ocean at surface and 1000 m depths. Envelope height (shown here for 40°N) represents the difference between maximum and minimum mean monthly temperatures for a given latitude. Data from NOAA WOA13 V2. (Online version in colour.)

