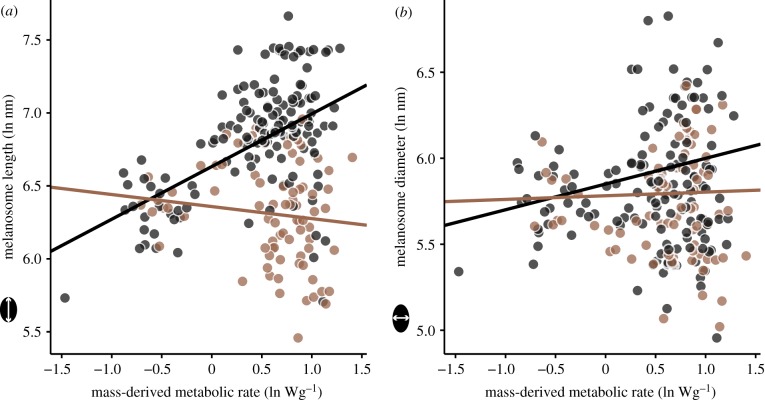
Figure 2.
Black and brown integument colours covary with metabolic rate in different ways. Panels show relationships between mass-derived metabolic rate and melanosome length (a) and diameter (b), for black (n = 134) and brown integument colours (n = 78). Note the different scales on the y-axes. The relationship between metabolic rate and morphology was significant for black (Wald test, p < 0.001) but not brown colours (p = 0.52).

