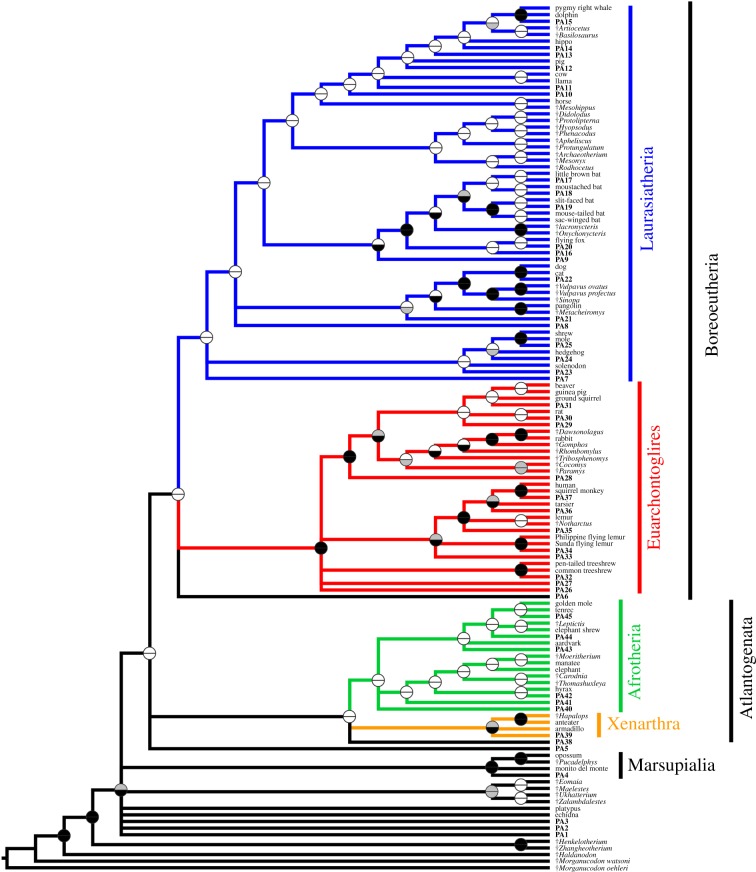
Figure 2.
Phylogeny of mammals based on maximum parsimony (MP) analysis of a modified version of the morphological dataset of O'Leary et al. [3] and with ‘max preservation’ predicted ancestors (PAs) added. Topology shown is a strict consensus of 64 most parsimonious trees. Ancestral states for the predicted ancestor were reconstructed using MP. Predicted ancestors are shown in bold, with numbers corresponding to the nodes for which they are ancestral, as shown in figure 1a. Fossil taxa are indicated with †. Circles at nodes indicate support, with the top half representing standard bootstrap values and the bottom half ‘transfer bootstrap expectation’ (TBE) values: black indicates greater than or equal to 70% support, grey 50–69% and white less than 50%.

