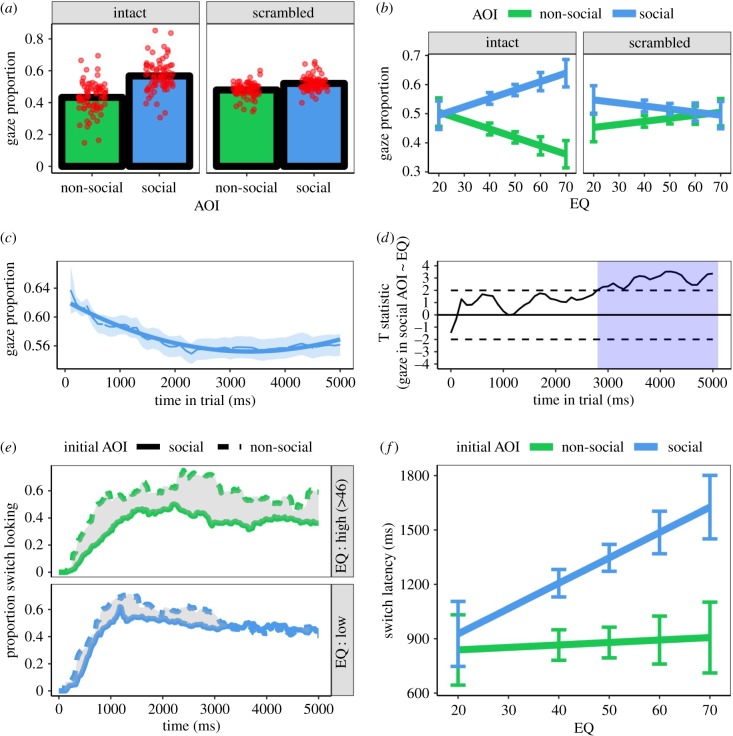
Figure 4.
(a) Gaze proportion as a function of AOI and stimulus type. Red points indicate individual data. (b) Gaze proportion as a function of AOI, stimulus type and EQ. Error bars are ±1 s.e.m. (c) The fit to gaze proportion time series with AOI and a linear and quadratic time regressors as fixed effects. Data are shown for the social AOI. (d) t-statistics for the test that EQ is a linear predictor of gaze proportion into the social AOI within each 100 ms time bin. Shaded areas demarcate the time bins wherein the statistic reaches the (uncorrected) threshold for rejecting the null hypothesis. (e) Proportion of observers who switched to the alternate AOI as a function of initial AOI and EQ (median split). (f) Switch latency as a function of initial AOI and EQ. Error bars are ±1 s.e.m. (Online version in colour.)

