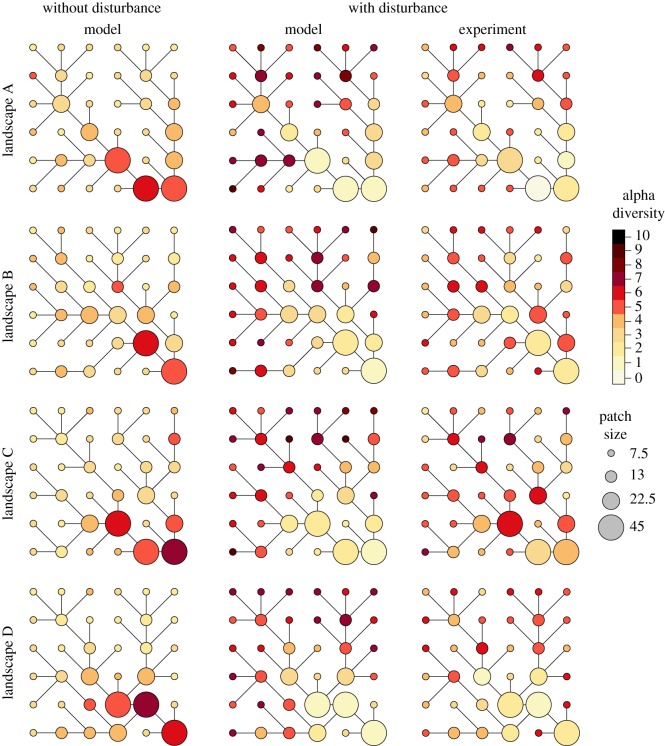
Figure 1.
Diversity distribution (local species richness) in dendritic, river-like landscapes with and without disturbance. The ‘Model’ landscapes displayed in this figure are examples of simulations made with the same replicate community. Results were qualitatively similar for each of the 10 replicate communities randomly generated (see electronic supplementary material, figure S4); model parameters specific to these simulations are dispersal δV = 0.05, mortality rates m are 0.1, 0.0868, 0.064, and 0.01, respectively, from smaller to larger patches for simulation with disturbance (patch size-dependent mortality) and 0 without. For network graphs based on experimental results, each graph represents the local diversity pattern for one of the four landscape replicates (A, B, C, and D). For illustration purposes, all network graphs are depicted at snapshots of diversity patterns at time of comparable local diversity: time 118.4 (simulations without disturbance; faster dynamics), time 167.9 (simulations with disturbance; slower dynamics), and at experimental day 29 (last sampling day). See complete dynamics over time for model simulations in electronic supplementary material, figure S4 and for experimental results in electronic supplementary material, figure S5.

