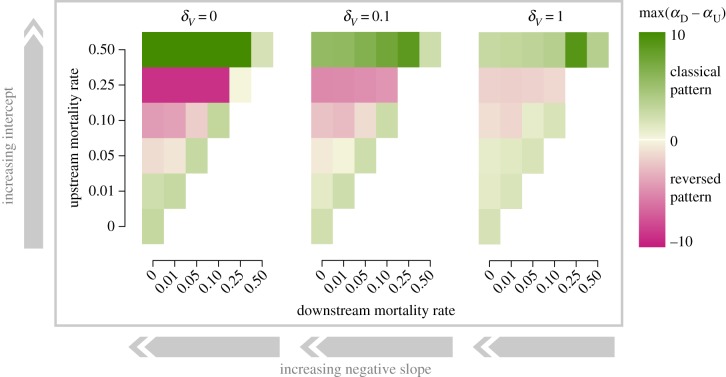
Figure 4.
Persistence of diversity patterns in dendritic, river-like landscapes. The figure illustrates the parameter space within which each diversity pattern is found as a function of the strength of disturbance (patch size—mortality rate relationship) and the magnitude of dispersal (for more dispersal rates see electronic supplementary material, figure S6). δV is the dispersal volume, with which we vary the dispersal rate (dx = δV/Vx, with Vx the volume of patch x). αD–αU corresponds to the maximum observed difference, along the temporal dynamics, in richness between the largest and smallest patches. When αD–αU is positive (green colours), the classical pattern emerges over the course of the dynamics, with higher diversity in large than in small patches, while when the difference is negative (pink colours), it is the reversed pattern, with higher diversity in small (i.e. headwater) rather than in large patches. Each case represents an average over 50 replicate simulations (five different landscapes × 10 different communities). Mortality rate increase in small upstream patches raises the intercept of the negative mortality rate–patch size relationship, while mortality rate increase in large dowstream patches reduces its slope.

