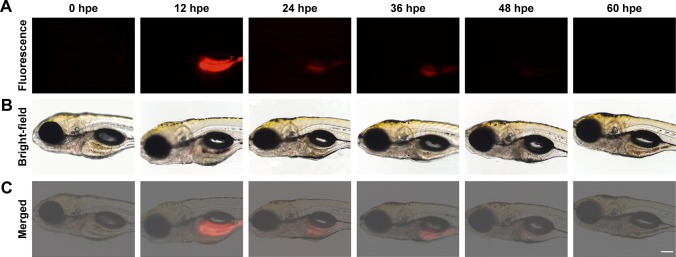
Figure 4.
Time-lapse distribution of FA-NPMOFs in zebrafish larvae.
Notes: (A, B) Fluorescence and bright-field images of FA-NPMOF-exposed larvae at 5 days post fertilization. Note that the red fluorescence was emitted by FA-NPMOFs. (C) Merged images from (A and B). Scale bar: 100 µm.
Abbreviation: FA-NPMOF, folic acid-nanoscale gadolinium-porphyrin metal-organic framework; hpe, hours post exposure.

