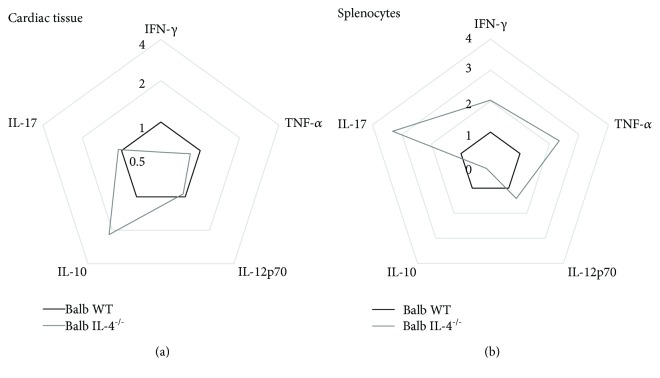
Figure 5.
Radar plot representation of cytokine profile in cardiac tissue and splenocytes. The lines highlight the fold change in cytokine production in IL-4−/− Balb/c (gray line) in relation to WT Balb/c mice (black line). Data were obtained by calculating the ratio between the mean concentrations of each cytokine in the IL-4−/− Balb/c-infected group and WT Balb/c-infected mice.

