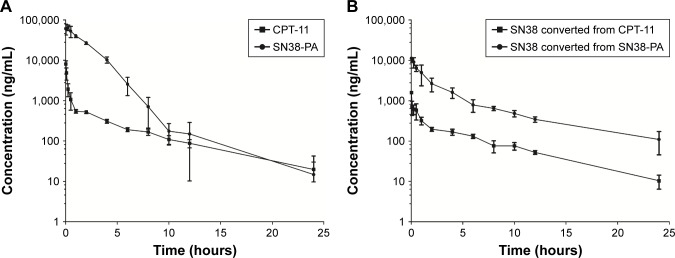
Figure 6.
Plasma concentration–time curve of CPT-11 injection (15.88 mg/kg) and SN38-PA liposome (16.06 mg/kg) after i.v. bolus injection in rats.
Notes: (A) Concentration–time curve of CPT-11 and SN38-PA. (B) Concentration–time curve of SN38 converted from CPT-11 and SN38-PA. Data are presented as mean ± SD (n=6).
Abbreviation: i.v., intravenous.

