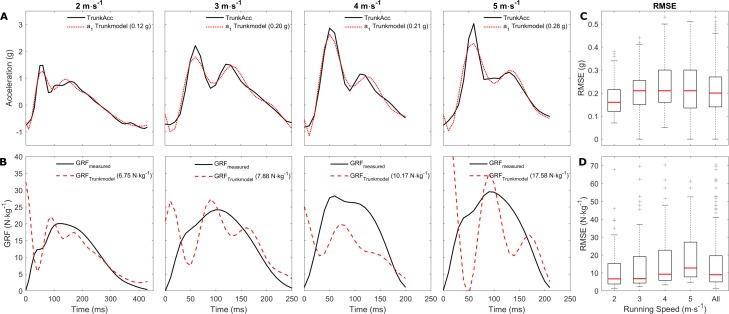
Figure 3. Representative examples of the trunk accelerometry fitting and GRF prediction, and the median RMSE across running speeds.
Representative examples of a single stride from multiple subjects. (A) display the fitting of the upper mass acceleration to the trunk accelerometry signal across running speeds, and (B) display the measured and predicted GRF for the same trials. The RMSE for the trunk accelerometry fitting and GRF predictions are displayed in brackets for the individual examples. (C and D) display the average RMSE median, and 25th and 75th interquartile range for the trunk accelerometry fitting and GRF prediction respectively within and across the individual running speeds. A total of 17 extreme outliers (3 m s−1: 3; 4 m s−1 : 7; 5 m s−1 : 7 outliers) were removed through visual inspection from the boxplots in (D) to improve the visual interpretation.

