
Figure 1.
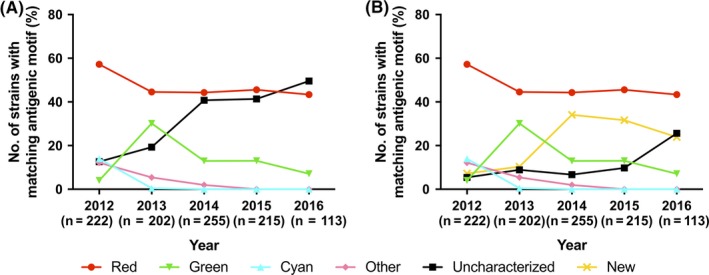
Temporal frequency of H3 antigenic clusters. (A) Temporal frequency of H3 antigenic clusters prior to this study. (B) Temporal frequency of H3 antigenic clusters following this study. Cluster designations and coloring follow the color scheme used previously by Lewis et al.12 Strains denoted “Other” encode outlier antigenic motifs of low prevalence. Strains encoding an antigenic motif not yet phenotypically characterized are denoted as “Uncharacterized”, while “New” strains encode an antigenic motif characterized in this study