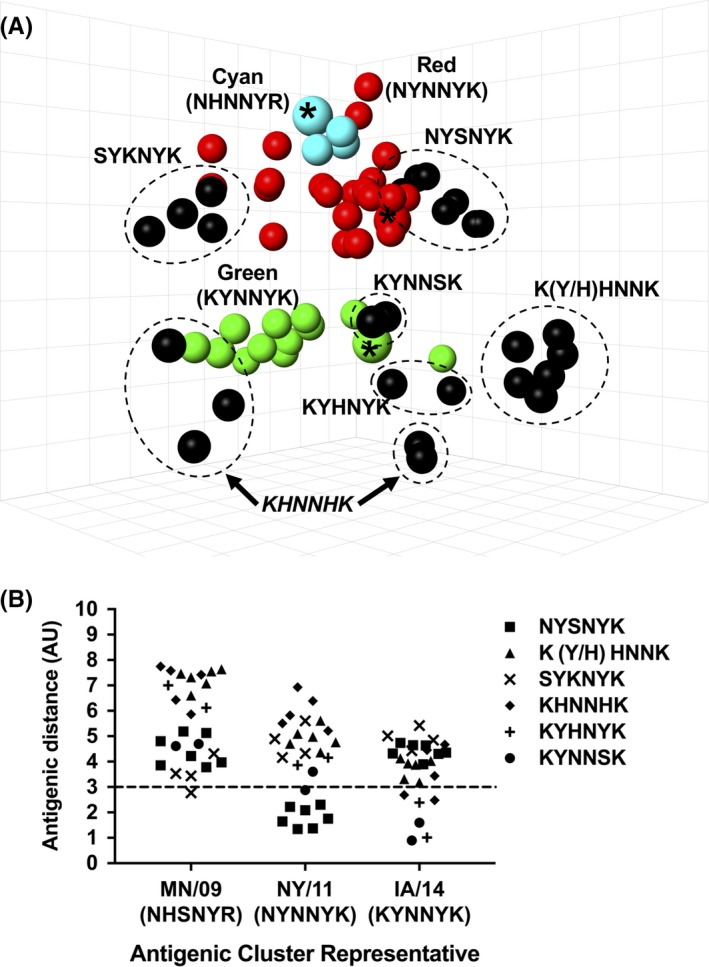
Figure 2.

Antigenic phenotype of strains encoding a previously uncharacterized motif. (A) Three‐dimensional antigenic map of strains encoding a previously uncharacterized motif. Viruses encoding identical antigenic motifs are grouped (dotted circles) and labeled. Predominant antigenic clusters from 2009 to 2016, with cluster representative viruses denoted by an asterisk (*), are visualized for reference (the dominant antigenic motif is indicated for each colored phenotype). (B) Antigenic distance from Cyan (MN/09), Red (NY/11), and Green (IA/14) cluster representative strains. The 3 antigenic unit (AU) line denotes an 8‐fold loss in HI cross‐reactivity, the cutoff typically used in human H3 IAV antigenic studies to define significant antigenic drift
