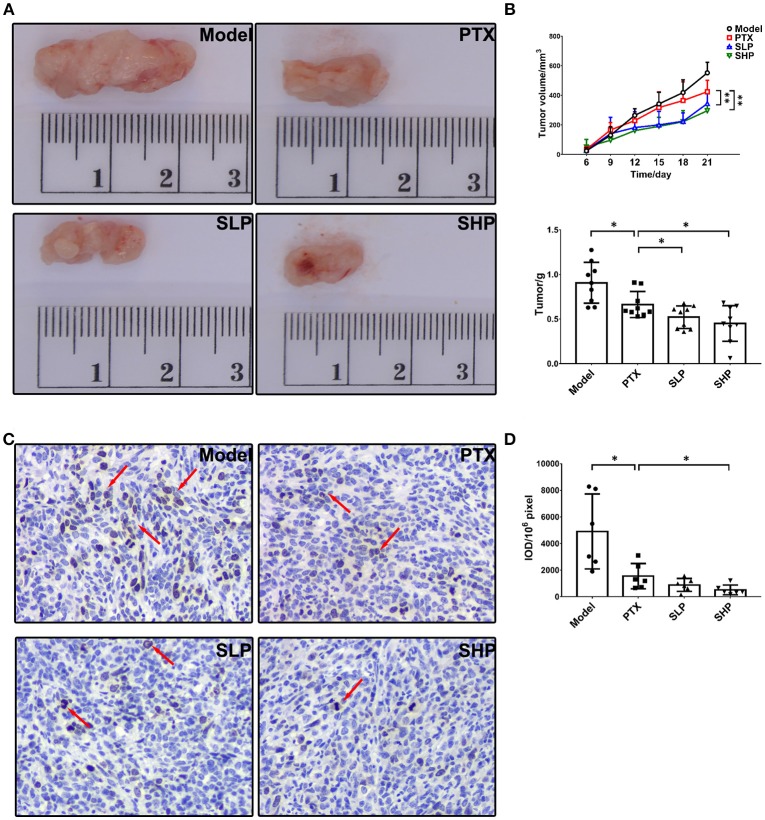
Figure 1.
Tumor growth observation. (A) Tumor volume (n = 9). Tumor volume change between groups were compared by repeat measurement ANOVA. (B) Tumor mass (n = 9). (C,D) Immunohistochemistry for ki67 in tumor and the representative image (200×, n = 6). The mean density of positive area was calculated as ratio of integrated optical density to the total pixel of each picture (IOD/106 pixel). Values were represented the means ± SD. *p < 0.05 and **p < 0.01.

