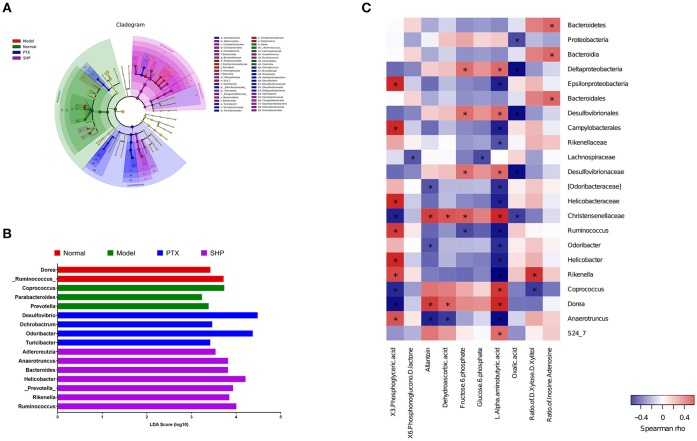
Figure 6.
Lefse analysis and metabolic pathway enrichment analysis for microbiota in the cecum content. (A) Overall exhibition of Lefse analysis by cladogram. (B) LDA scores results of the specific enriched genera in each group. (C) Spearman analysis of microbiota-metabolite relationship presented by heatmap. *p < 0.05.

