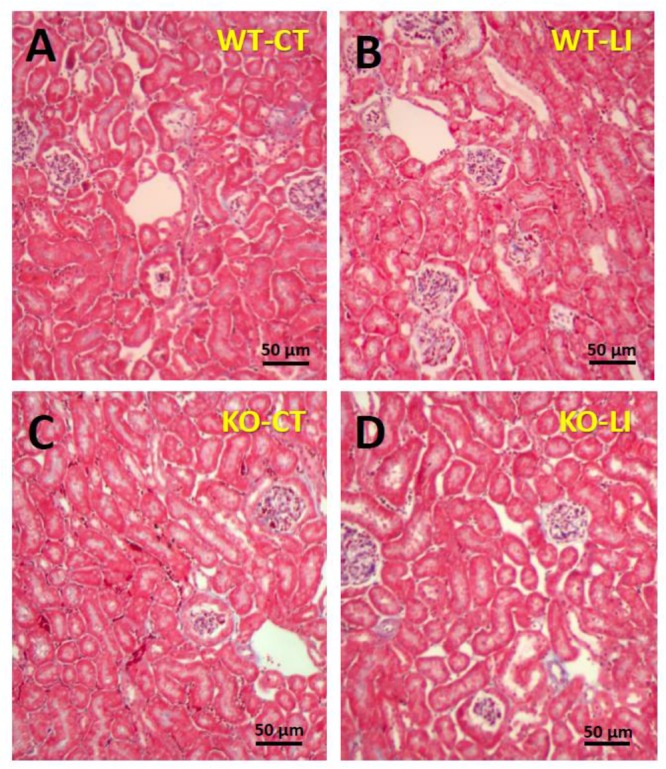
FIGURE 11.

Representative profiles of Masson’s trichrome stained kidney sections of WT and P2Y2 KO mice fed control (CT) or lithium-added (LI) diets for 5 months. Formalin-fixed and paraffin-embedded kidney samples were sectioned and stained with Masson’s trichrome reagent. (A) WT control mouse; (B) WT lithium mouse; (C) KO control mouse; and (D) KO lithium mouse.
