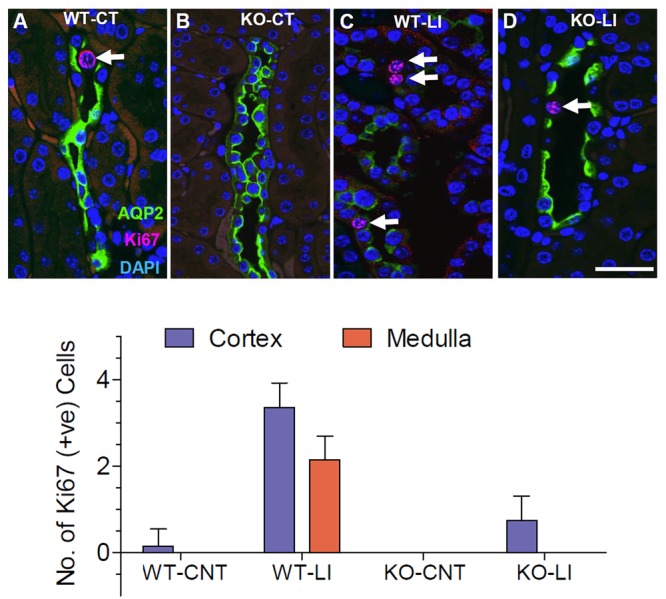
FIGURE 13.

Representative profiles of immunofluorescence analysis of cell proliferation in the collecting ducts of wild type (WT) and knockout (KO) mice fed control (CT) or lithium-added (LI) diets for 5 months. (A–D) Representative images from the renal cortex. AQP2 immunolabeling (green) was used to identify the principal cells of the collecting duct. Sections were co-stained for the Ki67 (red) nuclear cell marker for proliferation. Nuclei are stained with DAPI (blue). Note the significantly increased number of Ki67+ cells (arrows) in lithium-treated WT mice, and the diminished AQP2 immunofluorescence in response to Li-treatment in WT, but not in KO mice. Bar is 20 μm. Bottom panel: Graphical representation of the statistical summary of the density (% of all CD cells in full frame) of Ki67+ cells in cortical and medullary collecting ducts in WT, or KO mice fed control or lithium-added diets (n = 4–5 each group).
