
FIGURE 2.
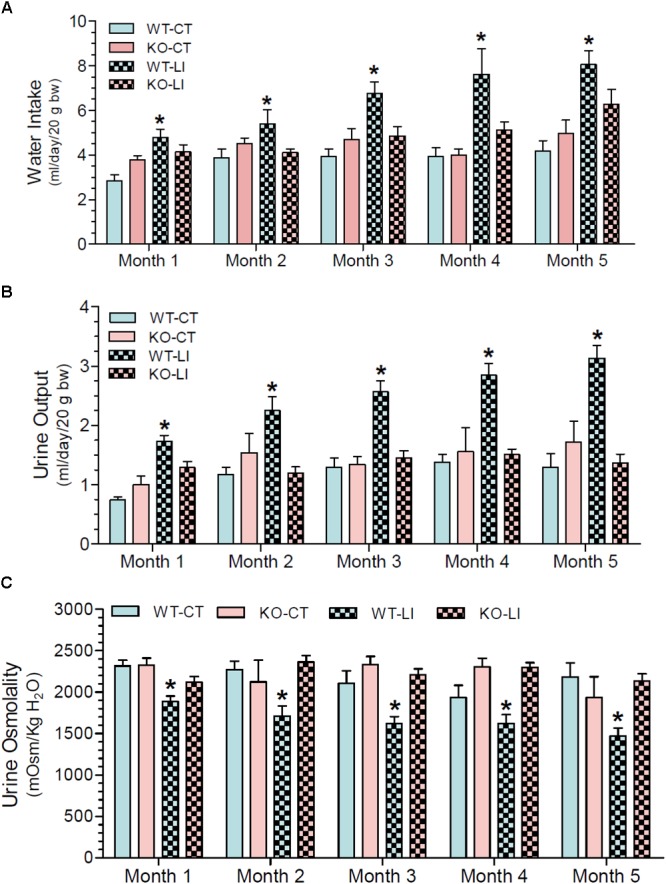
Monthly record of water intake (A), urine output (B), and urine osmolality (C) in WT and P2Y2 KO mice fed control or lithium-added diet for 5 months. Values shown are mean ± se (CT, n = 5 mice/genotype; LI, n = 10 mice/genotype) of two consecutive. One-way ANOVA: Water intake: ∗significantly different from the corresponding WT-CT at all time points, and from the corresponding KO-LI at all time points except month 1. Urine output: ∗significantly different from the corresponding WT-CT and KO-LI at all time points. Urine osmolality: ∗significantly different from the corresponding WT-CT and KO-LI at all time points.