FIGURE 2.

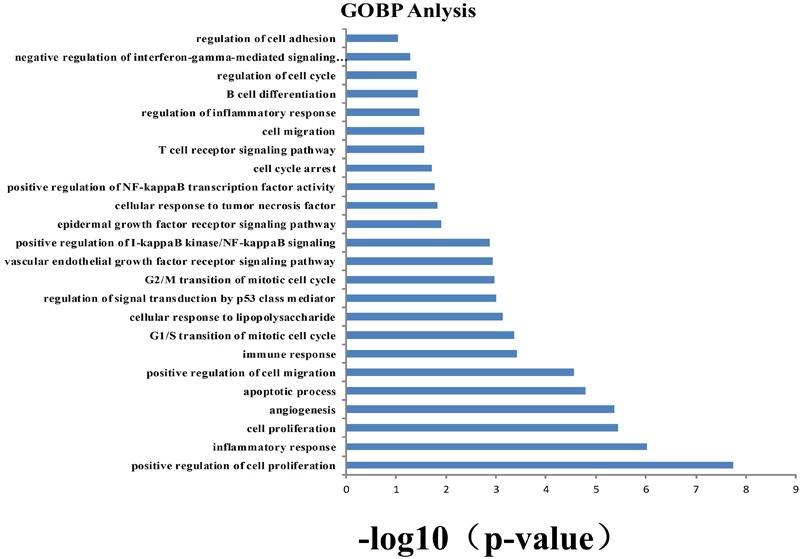
Gene ontology (GO) analysis of potential target genes. y-axis shows significantly enriched “biological process” (BP) categories in GO relative to the target genes, and x-axis shows the counts of targets.

Gene ontology (GO) analysis of potential target genes. y-axis shows significantly enriched “biological process” (BP) categories in GO relative to the target genes, and x-axis shows the counts of targets.