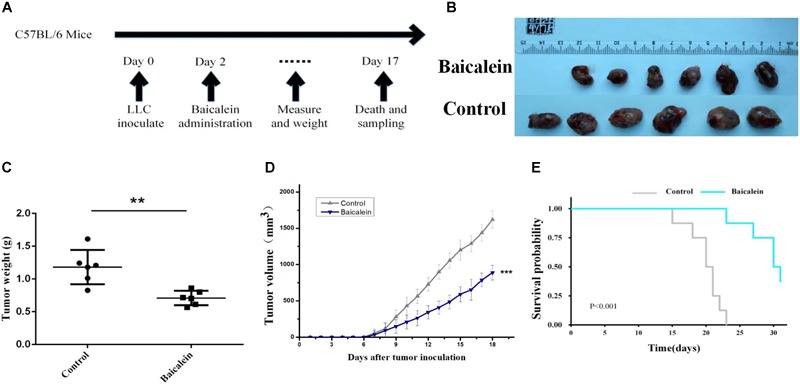
FIGURE 7.

In vivo Experimental validation. (A) Schematic diagram of in vivo experimental schedule. (B,C) LLC-tumors derived from control and baicalein (5 × 10⁵ cells per C57B/L6 mice, six mice for each group) were photographed and weighed immediately after tumor extraction (mean ± SD; ∗∗p < 0.01). (D,E) LLC-bearing mice were treated with control and baicalein. Tumor volume and survival rates are shown in (D,E). Data represent the means ± SEM of six mice. ∗p < 0.05, two-tailed Student’s t-test.
