
FIGURE 4.
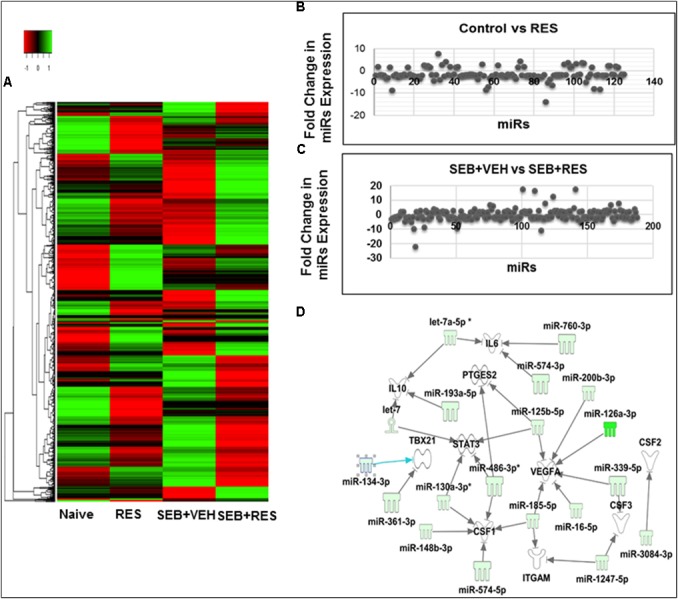
Heat map of miR expression in liver MNCs in mice with acute liver injury and Pathway Analysis of dysregulated miRs in liver MNCs. Acute liver injury was induced as described in Figure 1 legend. miR profile in liver MNCs was performed by using miR arrays on Affymetrix CGS300 System (Affymetrix). (A) Heat map depicting miR expression profile in liver MNCs of mice in the four groups. The expression pattern (green to red) represents the spectrum of downregulated to upregulated expression pattern of miRs, respectively. (B) Shows differential expression of miRs between Control and RES groups. (C) Shows differential expression of miRs between SEB+VEH and SEB+RES groups. (D) Dysregulated miRs in liver MNCs post-RES treatment in acute liver injury-induced mice were analyzed using Ingenuity pathway analysis (IPA) software online (Qiagen). There was a direct relationship of dysregulated miRs and several expected target genes including CSF gene families (CSF1, CSF2, CSF3), as well as VEGFA, PTGES2, STAT3, TBX21, and IL-10.