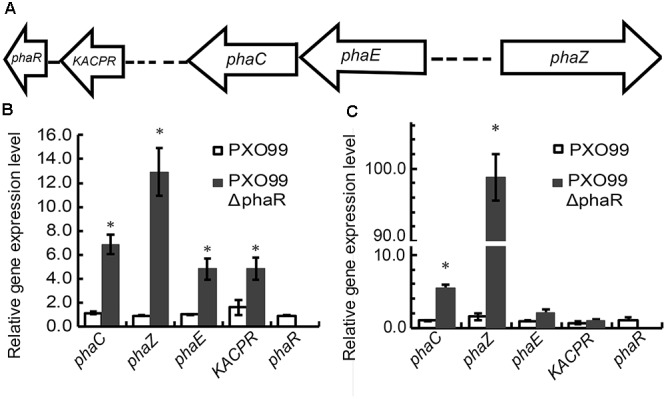
FIGURE 1.

The effect of phaR mutagenesis on the expression levels of other genes. (A) Genetic organization of the pha gene cluster. The arrows indicate the direction of gene transcription. (B,C) The relative expression levels of phaC, phaE, KACPR, phaZ, and phaR in phaR mutant and wildtype cultured in NB medium at 12 h (B) and 22 h (C) respectively, after inoculation. Error bars represent ±SD. The asterisk (∗) indicates a significant difference in Student’s t-test at p < 0.01.
