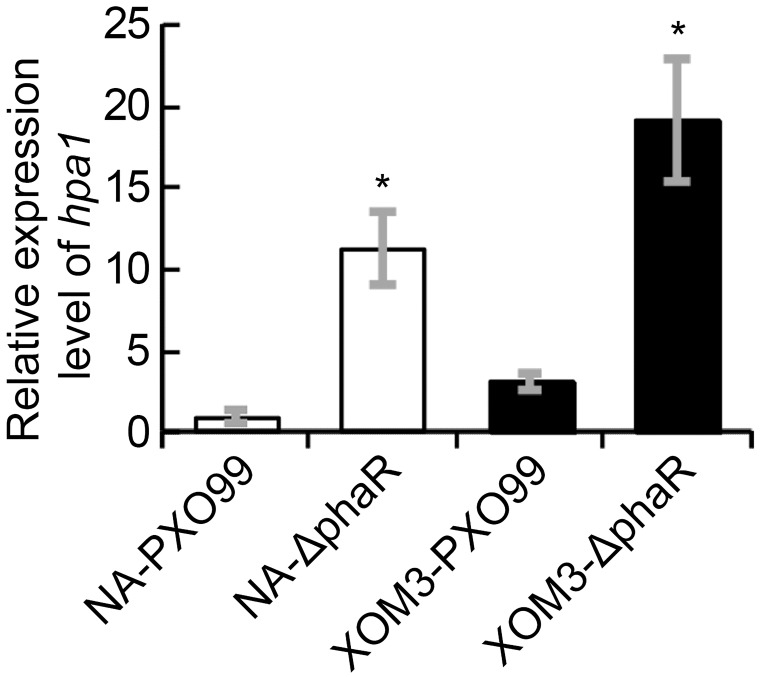
FIGURE 7.
The transcriptional levels of hpa1 in XOM2 and NB liquid media. The hpa1 gene expression was measured by quantitative real time PCR and compared between wildtype strain PXO99A and the mutant ΔphaR. The asterisk (∗) indicates a significant difference in Student’s t-test at p < 0.01. Error bars represent ±SD from three replicates.

