Figure 2.
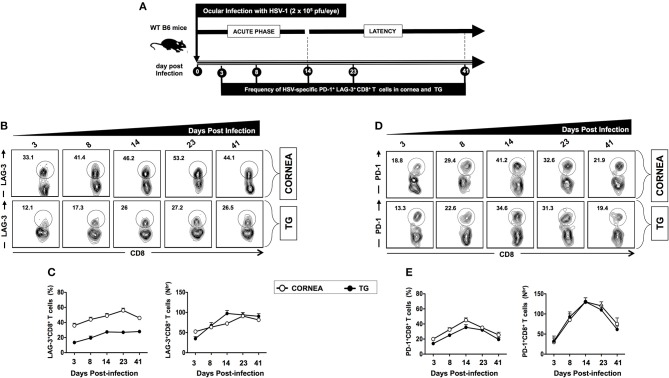
Kinetics of LAG-3 and PD-1 expression on HSV-specific CD8+ T cells following ocular herpes virus infection. (A) Schematic representation of the timeline for HSV-1 infection and assays on phenotypic exhaustion of HSV-specific CD8+ T cells in WT B6 mice (6–8 weeks old, n = 40), following ocular infection on day 0 with 2 × 10⁵ pfu of HSV-1 strain McKrae, as described in Materials and Methods. A group of 10 mice were sacrificed on days 3, 8, 14 (acute phase), 23, and 41 (latent phase) post-infection (PI). Subsequently, cornea and TG were harvested, and the frequencies of the HSV specific (gB498−505) CD8+ T cells expressing LAG-3 and PD-1 exhaustion markers were determined by FACS. (B) Representative FACS plot and (C) average percentages and absolute numbers of HSV-specific CD8+ T cells expressing LAG-3 are detected in cornea and TG at different time points. (D) Representative FACS plot, and (E) average percentages and absolute numbers of HSV-specific CD8+ T cells expressing PD-1 detected in cornea and TG at different time points. The results are representative of two independent experiments.

