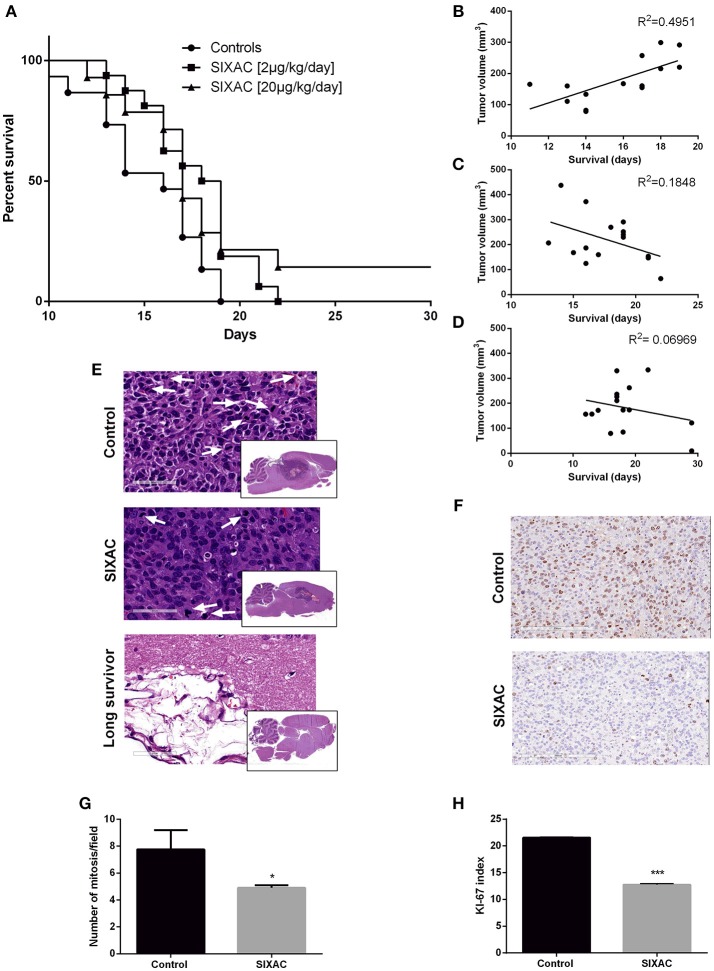
Figure 4.
Improved survival and histopathological measures in GBM CNS-1 model rats treated by SIXAC. (A) Kaplan-Meier curves comparing saline treated rats (circles) to groups of high (triangles) and moderate (squares) dose of SIXAC treated rats. There was a significant trend of prolonged survival in comparing the three groups (log-rank test for trend; p = 0.030). The effect of the moderate dose treatment on survival was more pronounced (log-rank test; p = 0.01) than the effect of the low dose (p < 0.05) in comparison to the saline treated group. PM brain tumor volumes in correlation to survival in days. Linear regression lines and Pearson R2 values are shown for each group. (B) Control group, (C) Moderate dose treated group, (D) High dose treated group. Number of animals: control = 15, SIXAC moderate dose = 16, SIXAC high dose = 14. (E) Representative H&E brain stainings of control, SIXAC, and “long survivors” groups (magnification 10X). White arrows indicate mitosis (magnification 400X). (F) Representative Ki67 immunostaining of control and SIXAC group. (G) Number of mitosis/field as was calculated from H&E staining. (H) Ki67 index as was calculated using the ImmunoRatio application. Results are presented as mean ± SEM. *p < 0.05, ***p < 0.001.

