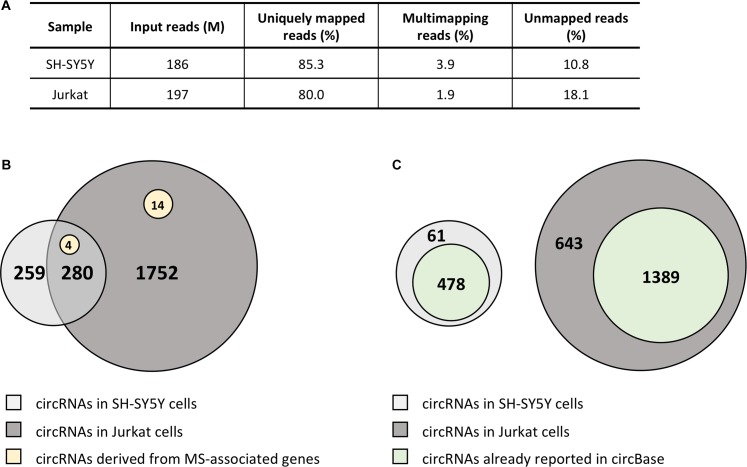
FIGURE 2.
CircRNA landscape of SH-SY5Y and Jurkat cells. (A) Table showing alignment statistics of RNA-seq experiments in SH-SY5Y and Jurkat cells. M, million reads. (B) Venn diagrams representing the number of circRNAs shared by SH-SY5Y and Jurkat cells. The number of circRNAs identified only in one cell type is also shown. Yellow circles represent those circRNAs derived from MS-associated genes. (C) Venn diagrams representing the number of circRNAs that were already described in circBase for each cell line.

