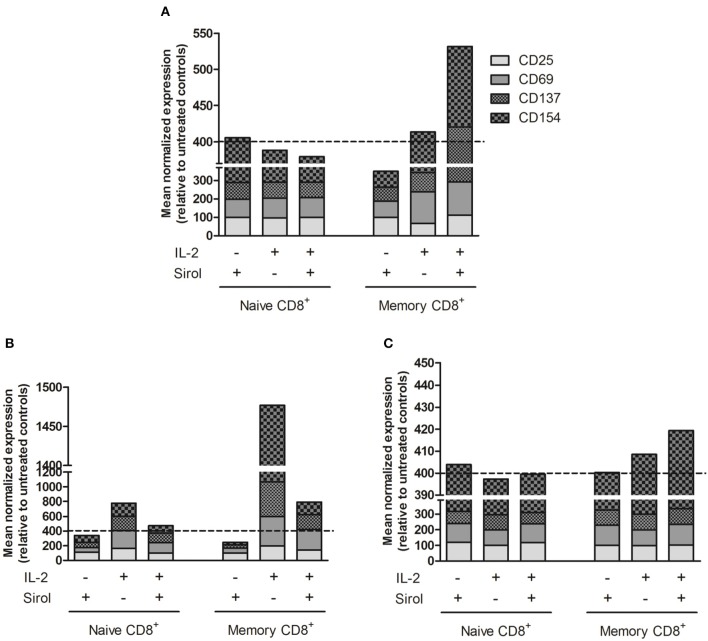
Figure 1.
Activation marker expression is induced on sirolimus-treated memory T cells after TCR activation and IL-2 supplementation. Surface activation marker expression was measured on naïve CD8+CD45RA+CD62L+ and memory CD8+CD45RA− T cells after treatment with (+) or without (–) sirolimus (Sirol, 10 ng/ml) in the presence (+) or absence (–) of IL-2 (50 U/ml). Shown are mean normalized percentages of activation markers relative to untreated controls (indicated as dashed lines). (A) Stimulation on allogeneic irradiated CD3− cells (n = 6). (B) Stimulation on anti-CD28-coated plates (n = 5). (C) Stimulation with anti-CD3/CD28 beads (n = 3).

