Figure 2.
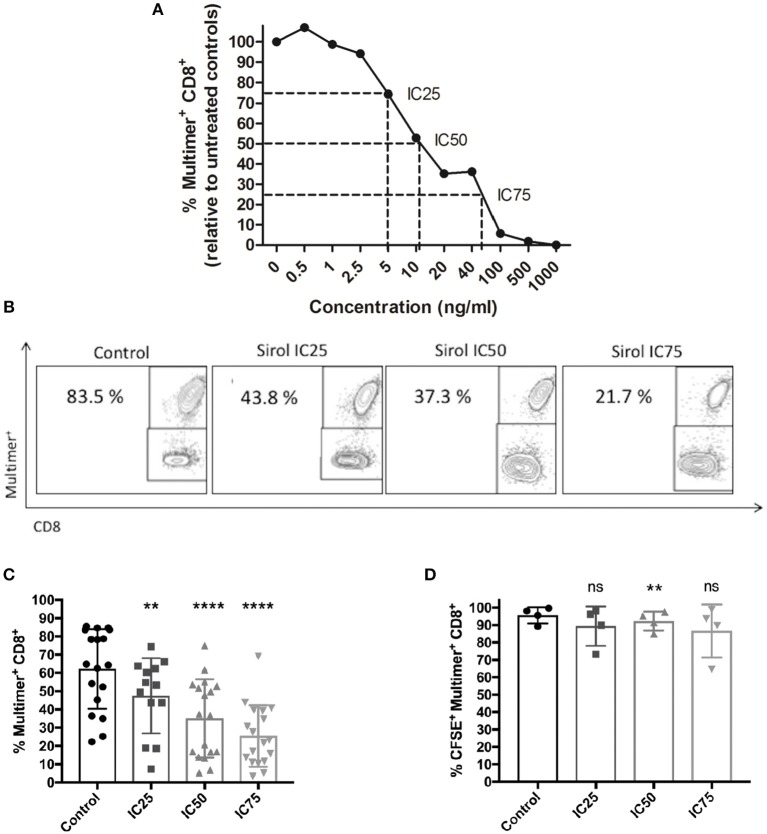
Dose-dependent suppression of CMV-specific T-cell expansion by sirolimus. (A) Normalized percentages (%) of CMV-specific multimer+CD8+ T cells (n ≥ 3) on day 7, as measured by multicolor flow cytometry. The indicated sirolimus (Sirol) concentrations (0.5–1,000 ng/ml) were added on day 0, and cells were stimulated with A02pp65p-loaded aAPCs in the presence of IL-2 (50 U/ml). Cultures without sirolimus served as controls. Optimal concentrations of sirolimus were defined by inhibition of CMV-specific CD8+ T cell expansion by 25% (IC25; 5 ng/ml), 50% (IC50; 10 ng/ml), and 75% (IC75; 40 ng/ml). (B) Representative dot-plot showing the percentages of expanded CMV-specific CD8+ T cells treated with sirolimus (from one donor). (C) Percentages of expanded multimer+ CMV-specific CD8+ T cells treated with sirolimus (n = 18). (D) Percentages of proliferated CFSE+multimer+ CMV-specific CD8+ T cells. Data are shown as means plus minus (±) standard deviation (SD). The two-paired Student's t-test was used to test for statistically significant differences [**p < 0.01, ****p < 0.0001, non-significant (ns)].

