Figure 8.
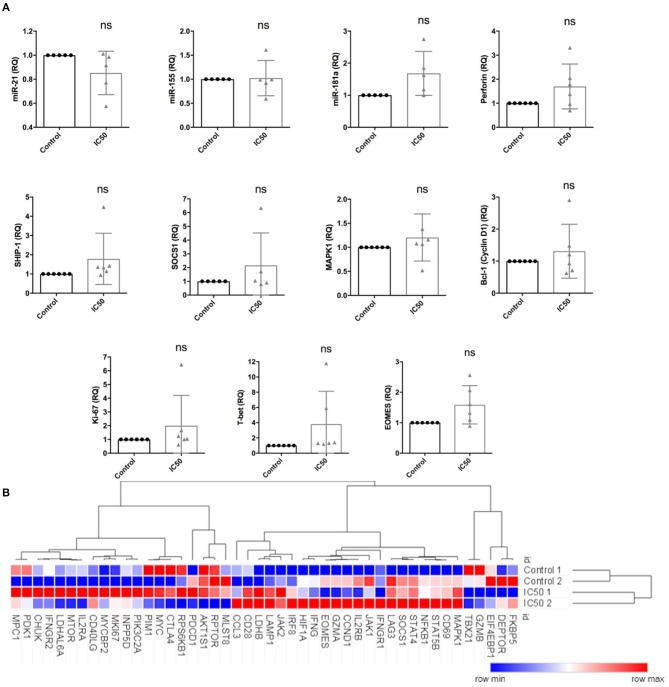
Sirolimus differentially affects the expression of target and effector genes and miRNAs. Expression levels of (A) miR-21, miR-155, miR-181a, perforin, SHIP-1, SOCS1, MAPK1, Bcl-1, Ki-67, T-bet and EOMES, as determined by RT-qPCR following overnight A02pp65p re-stimulation on 7 day aAPC stimulated CD8+ T cells treated with or without sirolimus in the presence of IL-2. (B) Selected results from global gene expression analysis in multimer-sorted CMV-specific CD8+ T cells on day 7 obtained from untreated (Control 1 and 2) and sirolimus-treated cells (IC50 1 and 2) of two donors (n = 2). CD8+ T cells were sorted based on their multimer specificity using high-speed flow cytometry sorters. Following overnight A02pp65p re-stimulation, total RNA was isolated and investigated by microarray analysis. Clustering and heat map analyses were performed using the Morpheus web-based tool. The data are means ± SD. The two-paired Student's t-test was used to test for statistically significant differences [non-significant (ns)].

