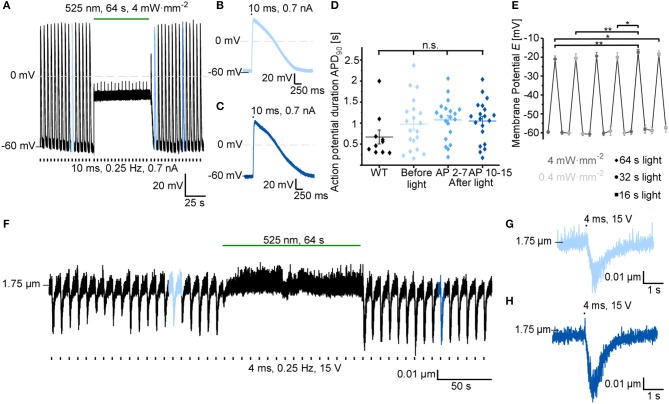
Figure 3.
GtACR1 inhibits electrically paced cardiomyocytes by depolarization. (A) Representative trace of cardiomyocyte membrane potential during electrical pacing (EP) at 0.25 Hz (current injections of 0.7 nA for 10 ms). A sustained 64 s light pulse inhibits AP generation by depolarizing the cell to about −20 mV. (B) 10th AP before light application. (C) 10th AP after end of light exposure. (D) Comparison of APD90 before light (AP 2-7) and at two different time points after light exposure (average APD90 of AP 2-7 and AP 10-15) to APD90 in non-transduced WT cells (WT n = 10, N = 1; GtACR1 transduced cells n = 23, N = 2). Wilcoxon test (WT vs. before light): p > 0.05. ANOVA one-way repeated Dunnett test (before vs. after light): p > 0.05. (E) Membrane potential E was recorded before, during and after light pulses of various durations (64 s, 32 s, 16 s) and light intensities (4 mW·mm−2, 0.4 mW·mm−2; n = 11, N = 2). Results of ANOVA one-way repeated Tukey are indicated in graph (*p ≤ 0.05, **p ≤ 0.01). (F) Representative sarcomere length recording. The cell was electrically paced at 0.25 Hz by field-stimulation (15 V) and sarcomere length shortening was inhibited by light for 64 s. (G) 6th contraction before light application. (H) 10th contraction after light application.

