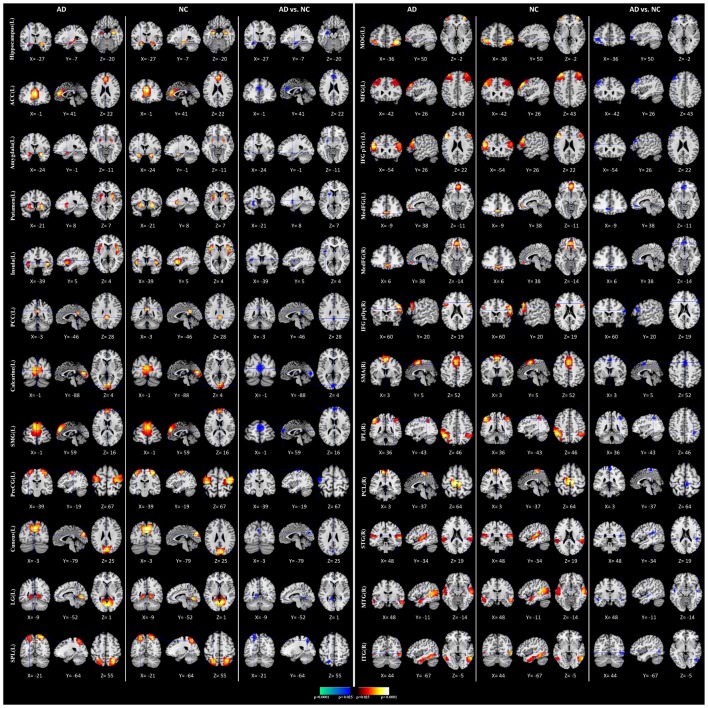
Figure 4.
Comparisons of functional connectivity (FC) between Alzheimer’s disease (AD) and normal controls (NCs). The first and fourth columns of three display the random-effect group connectivity maps detected from the AD. Within each column of three, the first column is a coronal view, the second is a sagittal view, and the third is an axial view. The second and fifth columns of three display the group connectivity maps detected from the NCs. Each row displays one group connectivity map generated by applying a one-sample t-test to the clusters of ICs. Any two group connectivity maps within the same row across the first three and second three columns (as well as the fourth three and fifth three columns) are significantly similar to one another in their spatial configurations. The third and sixth columns of three display t-contrast maps comparing the group connectivity maps from the AD and control participants. MFG, middle frontal gyrus; MedFG, medial frontal gyrus; SMG, superior medial gyrus; MOG, middle orbital gyrus; IFG pOp, inferior frontal gyrus (p. Opercularis); IFG pTri, inferior frontal gyrus (p. Triangularis); SMA, supplementary motor area; ACC, anterior cingulate cortex; PCC, posterior cingulate cortex; SPL, superior parietal lobule, IPL, inferior parietal lobule; PCL, paracentral lobule; STG, superior temporal gyrus; MTG, middle temporal gyrus; ITG, inferior temporal gyrus; PreCG, precentral gyrus; LG, lingual gyrus.

