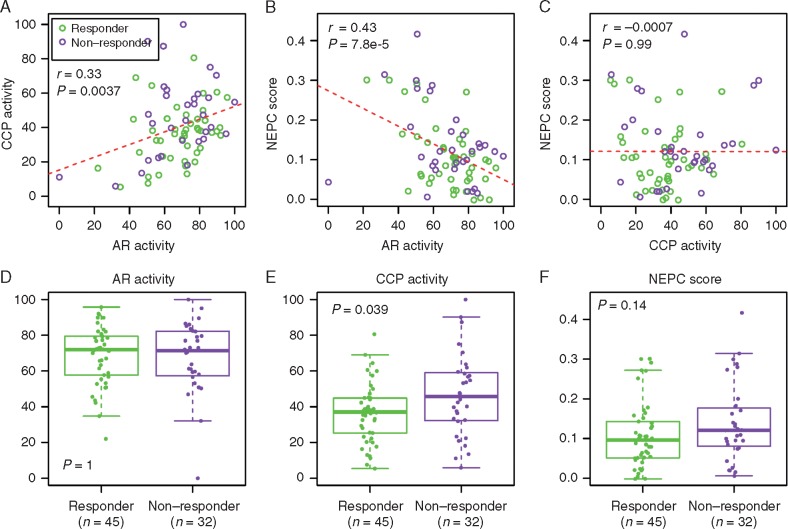
Figure 4.
Upper panel: associations between AR activity and CCP activity (A), AR activity and NEPC score (B), and CCP activity and NEPC score (C). Lower panel: Comparing AR activity (D), CCP activity (E), NEPC score (F) between responders (green) and nonresponders (purple). r, Pearson correlation coefficient; CCP, cell cycle progression; NEPC, neuroendocrine prostate cancer.

