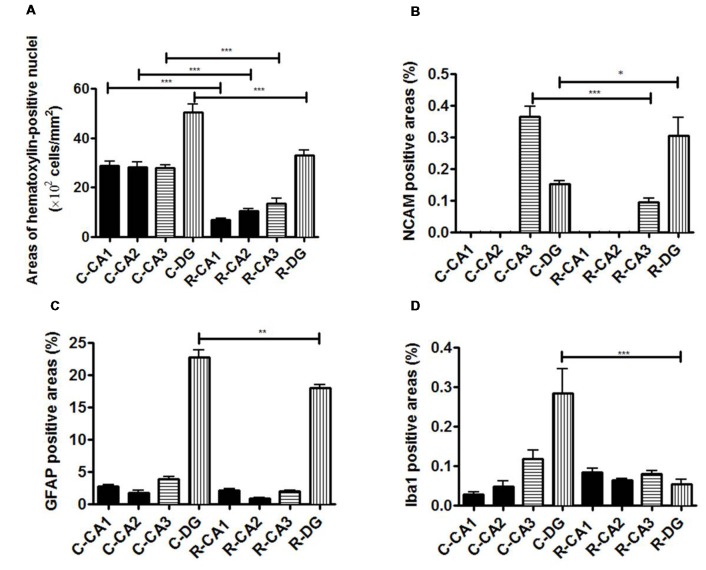
Figure 4.
Evaluation of immunohistochemical staining. (A) Comparison of the ratio of the number of HE-positive cells in the hippocampal sub-regions. (B) Comparison of the ratio of NCAM-positive cell areas in the hippocampal sub-regions. (C) Comparison of the ratio of GFAP-positive cell areas in the hippocampal sub-regions. (D) Comparison of the ratio of Iba-1-positive cell areas in the hippocampal sub-regions. Significant difference in the cell density in CA1, CA2, CA3 and DG was detected between 3-week-old normal and radiation-exposed rat brains. Significant difference in the percentage area of NCAM-positive mossy fibers through the DG to CA3 was detected between 3-week-old normal and radiation-exposed rat brains. In all subregions of the hippocampus, there were significant decreases in the cell density and mossy fiber areas in radiation-exposed rats as compared to control rats. The density of GFAP-positive cells in DG was higher in control rats than in radiation-exposed rats (C; ***p < 0.001). In addition, there were differences in the distribution of Iba1-positive cells in DG between the control and radiation-exposed rats (D; ***p < 0.001). *p < 0.05; **p < 0.001; ***p < 0.0001; Tukey’s multiple comparison test. N-CA1-3, CA1-3 of a normal rat; N-DG, dentate gyrus of a normal rat; R-CA1-3, CA1-3 of a radiation-exposed rat; R-DG, dentate gyrus of a radiation-exposed rat.

