Figure 5.

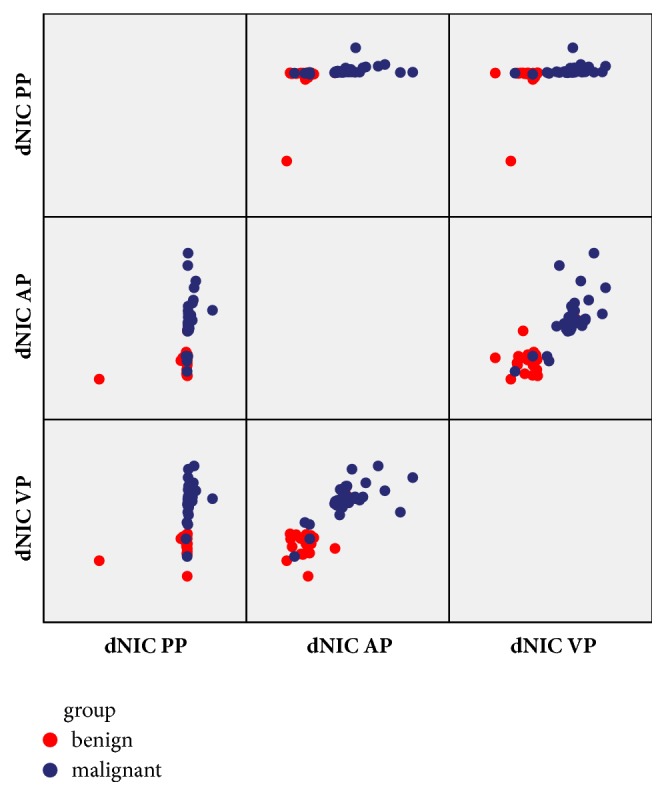
The three-dimensional scatter plots of dNIC between malignant and benign nodules in three phases. From the scatter plot, the dNIC distribution of malignant and benign nodules reflects distribution difference of iodine concentration.

The three-dimensional scatter plots of dNIC between malignant and benign nodules in three phases. From the scatter plot, the dNIC distribution of malignant and benign nodules reflects distribution difference of iodine concentration.