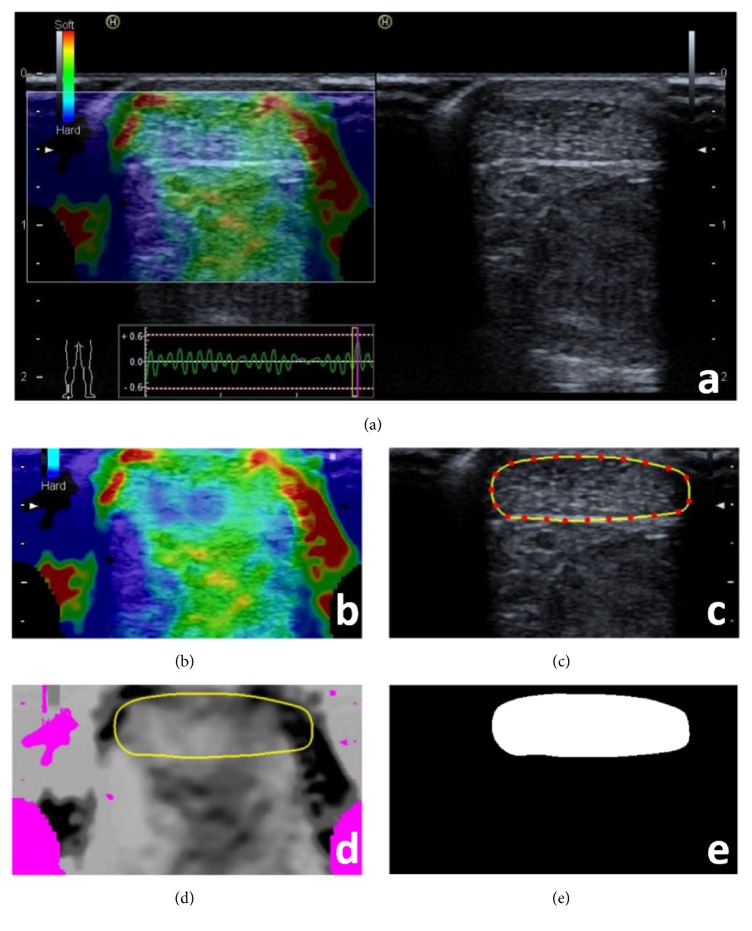
Figure 1.
An example for illustrating the computer-assisted quantification of tendon hardness on axial-strain sonoelastography (ASE). The imaging system provides dual-modality visualization in a full screen consisting of two parts: the right part depicts a greyscale B-mode image and the left is a composite colour image that is a pure colour elastogram overlaying the same B-mode image (a). The pure colour elastogram (b) is retrieved by subtracting the B-mode image from the composite image. The tendon borders are delineated by using interactive software (c). The pure colour elastogram is transformed to a greyscale image (d). The location of the tendon is depicted in a binary template (e).

