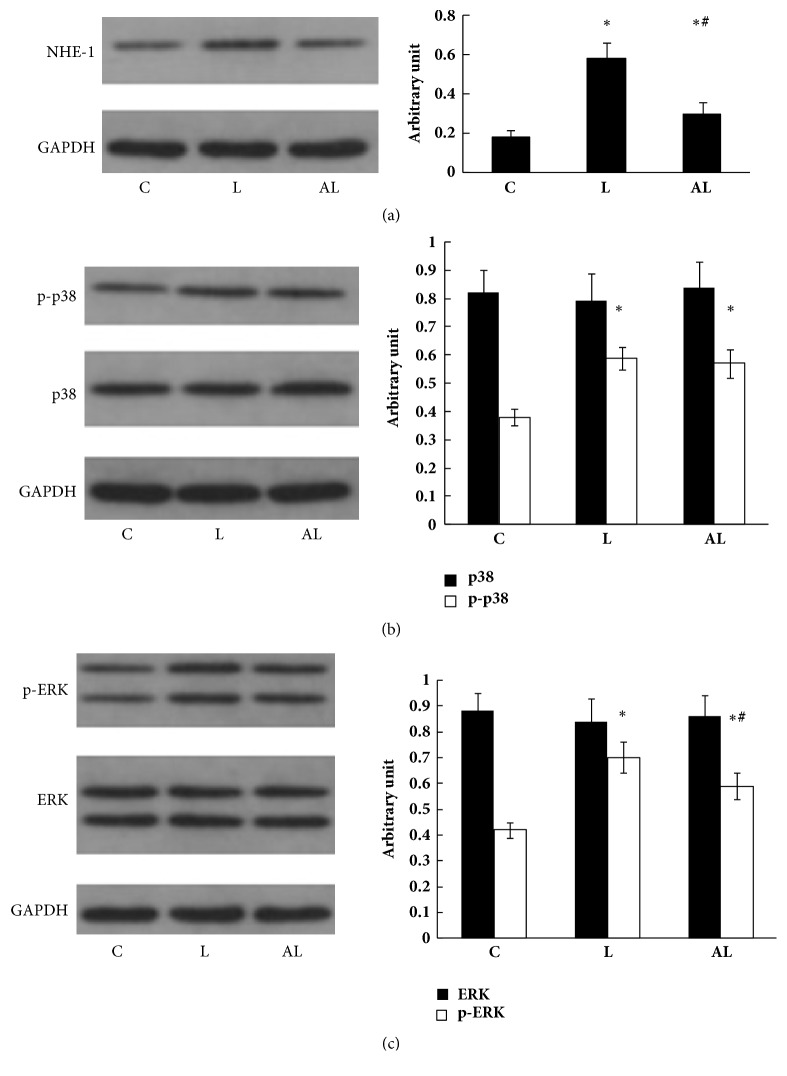
Figure 4.
Western blot analysis of NHE-1 (a), p38 and p-p38 (b), ERK and p-ERK (c) in lung tissue. Lane (C) C group; Lane (L) L group; Lane (AL) AL group. The left panel shows western blot of proteins in lung tissue. The right panel shows relative densitometric units. Data are expressed as mean ± SD of five independent experiments. ∗p<0.01 versus C group; #p<0.01 versus L group.

