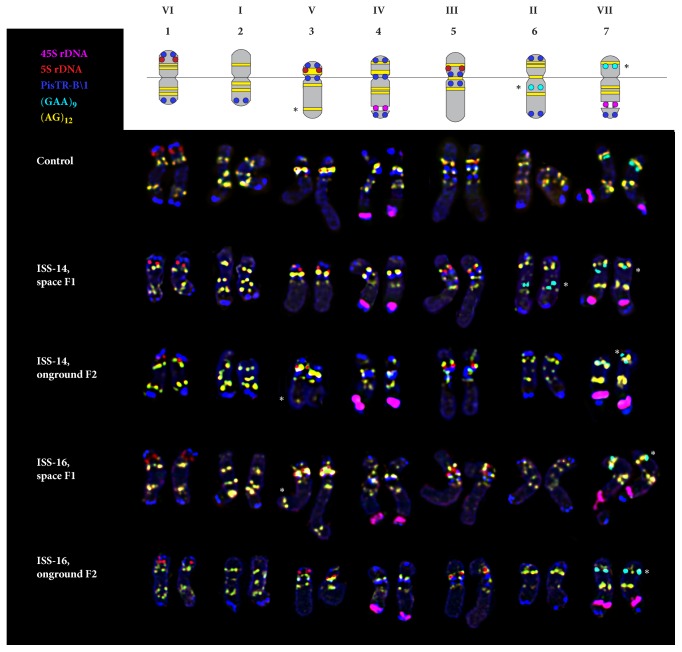
Figure 3.
Generalized idiogram of P. sativum chromosomes showing the chromosomal distribution of the examined markers and karyograms of the control and experimental samples. Chromosome numbers and linkage groups are denoted with Arabic and Roman numerals, correspondingly. Asterisks indicate polymorphic (GAA)9 and (AG)12 sites. The correspondent probes and their pseudocolours are specified on the left.

