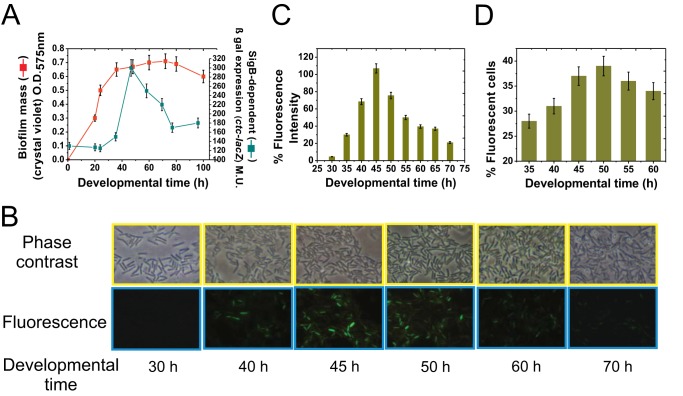
FIG 1.
SigB expression during the biofilm cell cycle. (A) Kinetics of biofilm formation and expression of the SigB-dependent ctc gene in biofilm-supporting LBY static culture. O.D.575nm, optical density at 575 nm; β-Gal, β-galactosidase. (B) Representative photographs from inner biofilm regions of GFP-expressing isogenic JH642 cells (strain MR655) at the indicated development times. Cells from exterior regions of the biofilm did not exhibit significant SigB-directed fluorescence (data not shown). Representative results from three independent experiments performed in parallel are shown. (C) Relative fluorescence intensity, indicated as a percentage of maximal (100%) SigB-directed gfp expression by the JH642 isogenic strain MR655 (amyE::PsigB-gfp::cat). Maximal fluorescence (100%) was considered to occur at 45 h of biofilm incubation. All of the other relative fluorescence levels, at the different times, were calculated as a percentage of the maximum fluorescence observed at 45 h of biofilm development. (D) Percentage of cells taken from inner regions of the biofilm that express GFP (MR655 strain). Each data point shown in panels A, C, and D is the mean ± SEM from a representative experiment performed in triplicate.

