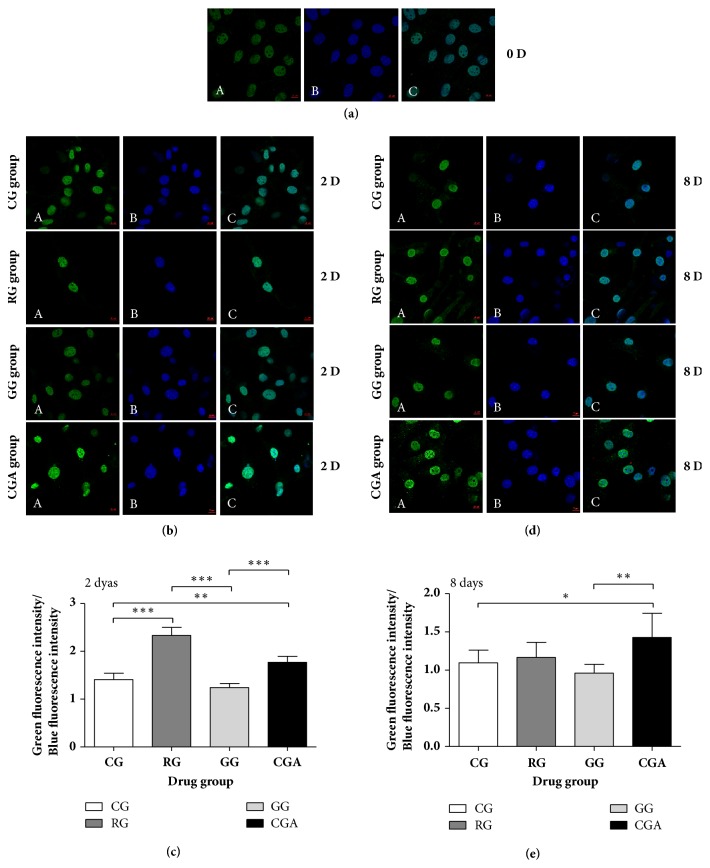
Figure 6.
Chlorogenic acid (CGA) enhances the expression of PPARγ2 during the differentiation process of mouse 3T3-L1 preadipocytes. Mouse 3T3-L1 preadipocytes were immunostained for PPARγ2 protein (green) (A), while nuclei were simultaneously revealed by DAPI staining (blue) (B). Colocalization is rendered in the merge panels (cyan) (C). Subcellular distribution of PPARγ2 and nuclei was analyzed by microscopic confocal analysis. (a) 0 days (630 ×); (b) 2 days (630 ×); (d) 8 days (630 ×). ((c) and (e)) The intensity of the green and blue fluorescence was quantified using ZEN 2 lite software. Data are shown as the means ± SD (n = 3). ∗P < 0.05, ∗∗P < 0.01, ∗∗∗P < 0.001.

