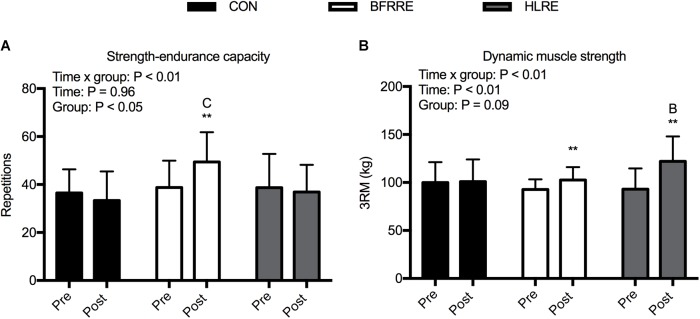
FIGURE 2.
Muscle functional capacity for CON, BFRRE, and HLRE groups. (A) strength-endurance capacity. (B) Dynamic muscle strength. ∗∗ denotes difference from pre-values within groups (P < 0.01), C denotes difference from CON at corresponding time point (P < 0.05), B denotes difference from BFRRE at corresponding time point (P < 0.05). Data are presented as means ± SD. Overall effects are designated in the upper left corner of each graph.

