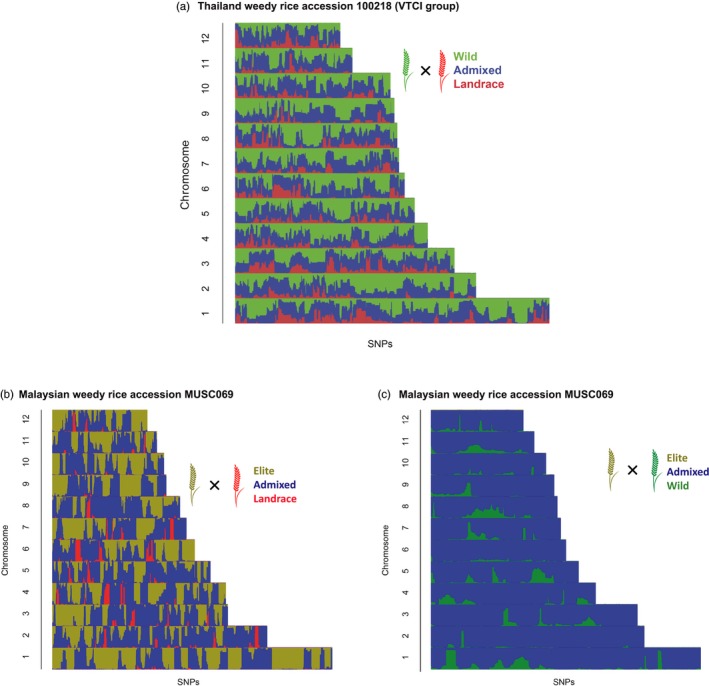
Figure 4.

Bar plots of HAPMIX results. (a) Thai weedy accession 100218 (representing weeds from Vietnam, Thailand, Cambodia, and Indonesia) under landrace × wild admixture model, (b) Malaysian weedy accession MUSC069 under the elite × landrace model, and (c) Malaysian weedy accession MUSC069 under the elite × wild rice model. Each horizontal bar represents one chromosome with SNPs along their length. The color for each SNP represents the probability of that SNP originating from one of the parent populations (green, wild; red, landrace; or gold, elite cultivar) or the probability of admixture between the two parents at that site (blue)
