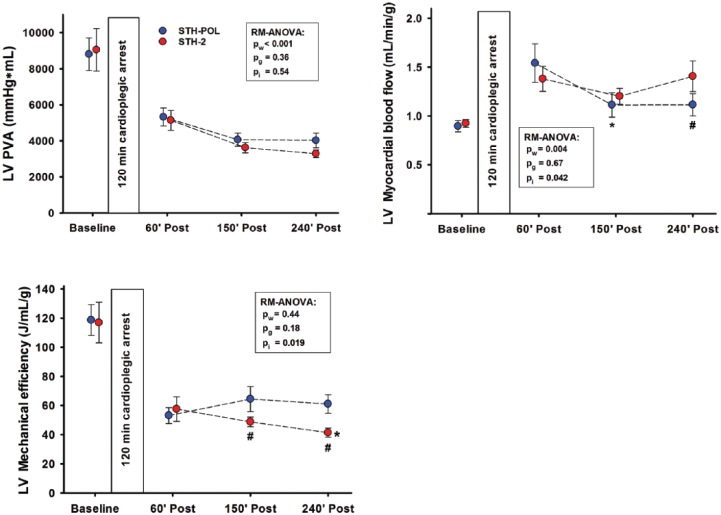
Figure 4.
Left ventricular (LV) pressure-volume area (PVA), myocardial blood flow rate and mechanical efficiency at Baseline and 60, 150 and 240 min after CPB and aortic declamping following 120 min of cardioplegic arrest, n=10 in both groups. Statistics as in Figure 2. *: significantly different from 60 to 150 or 240 min of reperfusion within group; #: significantly different between groups at corresponding point of time.

