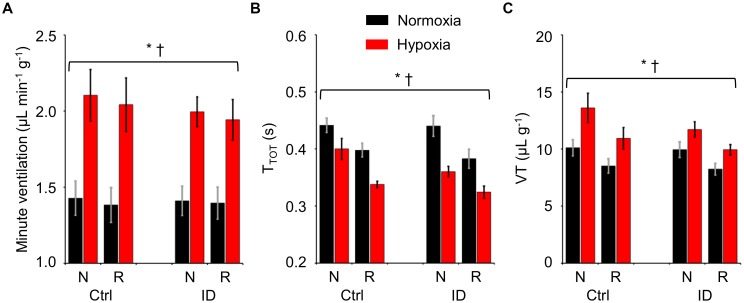
FIGURE 3.
Values of minute ventilation per unit body weight (A), ventilatory period (TTOT, B), and tidal volume per unit body weight (VT, C) during non-rapid-eye-movement sleep (N) and rapid-eye-movement sleep (R) in mice fed control diet (Ctrl) or iron-deficient diet (ID) during normoxia (black) and hypoxia (red). Data are means ± SEM with n = 11 per group. ∗ and †, P < 0.05, main effects of hypoxia and sleep state, respectively (ANOVA).

