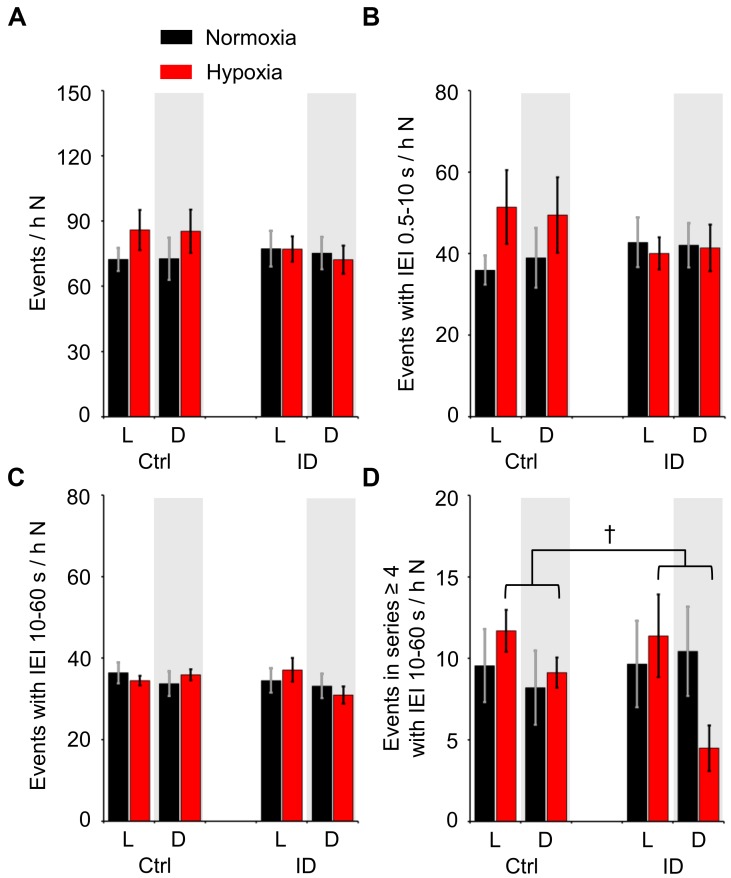
FIGURE 5.
Number of different categories of tibialis anterior (TA) electromyographic (EMG) events per hour of time spent in non-rapid-eye-movement sleep (N) during the light period (L) and the dark period (D, gray shading) in mice fed control diet (Ctrl) or iron-deficient diet (ID). (A) Total number of TA EMG events per hour N time; (B,C) number of TA EMG events separated by inter-event intervals (IEI) between 0.5 and 10 s (short-IEI TA EMG events) or between 10 and 60 s (long-IEI TA EMG events), respectively, per hour N time; (D) number of long-IEI TA EMG events in series of four or more, expressed per hour N time. Data are means ± SEM with n = 8 per group. †P < 0.05, L vs. D (t-test).

